Indicator model
Define objectives, metrics, sources and ownership.
 Consortiumof digital technologies
02 / Consortium expertise
We transform large spatial, infrastructure and sectoral datasets into understandable indicators and scenarios. Registers, maps, calculation models and management reports are connected so decisions can be traced to reliable source data.
Who it is for
We work with territorial communities, government authorities, municipal utilities, engineering organisations and responsible businesses.
We adapt the solution to real data, regulations, resources and client-team responsibilities. Delivery covers audit, requirements, design, implementation, training and support.
Scope
Modules are refined after reviewing source data and project goals.
Define objectives, metrics, sources and ownership.
Connect registers, GIS, documents, sensors and models.
Detect duplicates, gaps, conflicts and stale records.
Build maps, charts, filters and drill-down views.
Compare investment, reconstruction and resource options.
Automate programme control and result communication.
Outcomes
How we work
The approach is adapted to the client’s data, infrastructure and responsibilities.
To avoid dashboards becoming attractive but unused charts, we define the decisions the system must support. Every indicator receives a meaning, formula, source, update cycle, owner and quality threshold. This creates consistent interpretation across departments and allows users to trace a result back to the source records from which it was calculated.
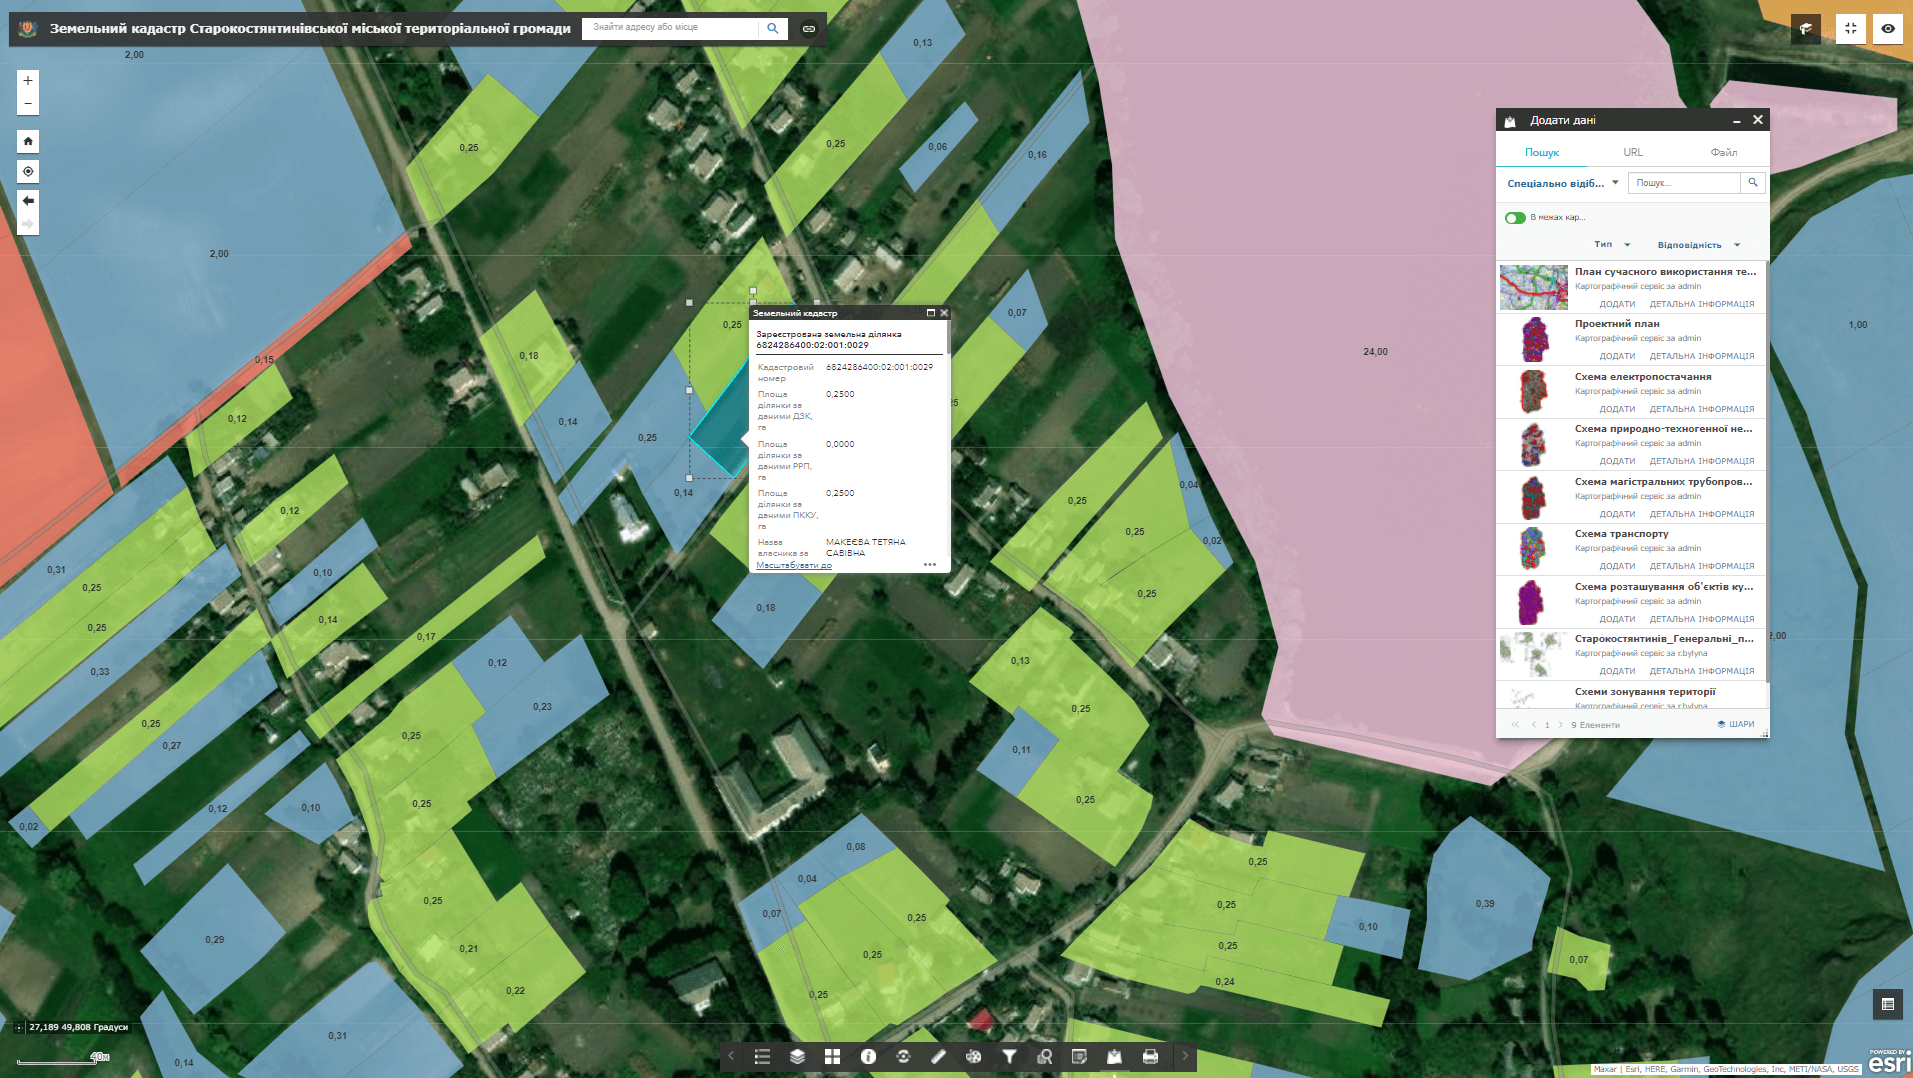
Many management questions have a geographic dimension: where demand grows, which assets face risk and which settlements lack services. Dashboards therefore connect to maps, registers, engineering models and documents. Users can move from an aggregate indicator to a district, network, programme, project or individual asset and understand the spatial pattern behind the number.
Before integration, we assess duplicates, missing values, conflicting classifications and stale records. Validation rules make problems visible rather than hiding uncertainty behind a precise-looking chart. This builds user trust and creates a practical roadmap for improving each data source, its update process and the responsibility of the team that maintains it.
An analytical platform can connect assets, budgets, funding sources, schedules, contracts, physical progress and community outcomes. Leaders can compare plan with actual delivery and identify delay early. A Dnipro City Council letter confirms consortium cooperation with GIZ, while Ekolas engineering references confirm work with network databases and calculation models; the sources remain correctly attributed.
Related projects
Each case states whether the experience belongs to the consortium or a specific founder company.
Documented evidence
Scanned letters open in their original form.
Official reference concerning the consortium’s cooperation with GIZ in 2025.
Open document ↗Ekolas Research and Production CentreThe document confirms comprehensive data collection, database development and a calculation model for network analysis.
Open document ↗Practical questions
Yes, after reviewing structure, access methods, data quality and ownership for each source.
It supports filtering, drill-down, asset-level navigation and regular updates under agreed calculation rules.
Yes. Indicators can cover funding, schedules, physical progress, risks, documents and achieved outcomes.
A client can start by sharing current reports, source systems, problematic indicators and decisions that require manual consolidation. We trace indicators to primary data, identify gaps and propose a first dashboard set with a measurable purpose. A prototype helps agree definitions, filters and drill-down before broader integration. Later stages cover automated updates, quality checks, permissions, reporting and training. The outcome is a regular data-management process rather than a one-off presentation that quickly becomes outdated, allowing analytical capability to grow with improved sources and organisational maturity.
IT OTG
Describe the context, expected outcome and timing. We will assemble the right team and propose the next step.
Discuss a project↗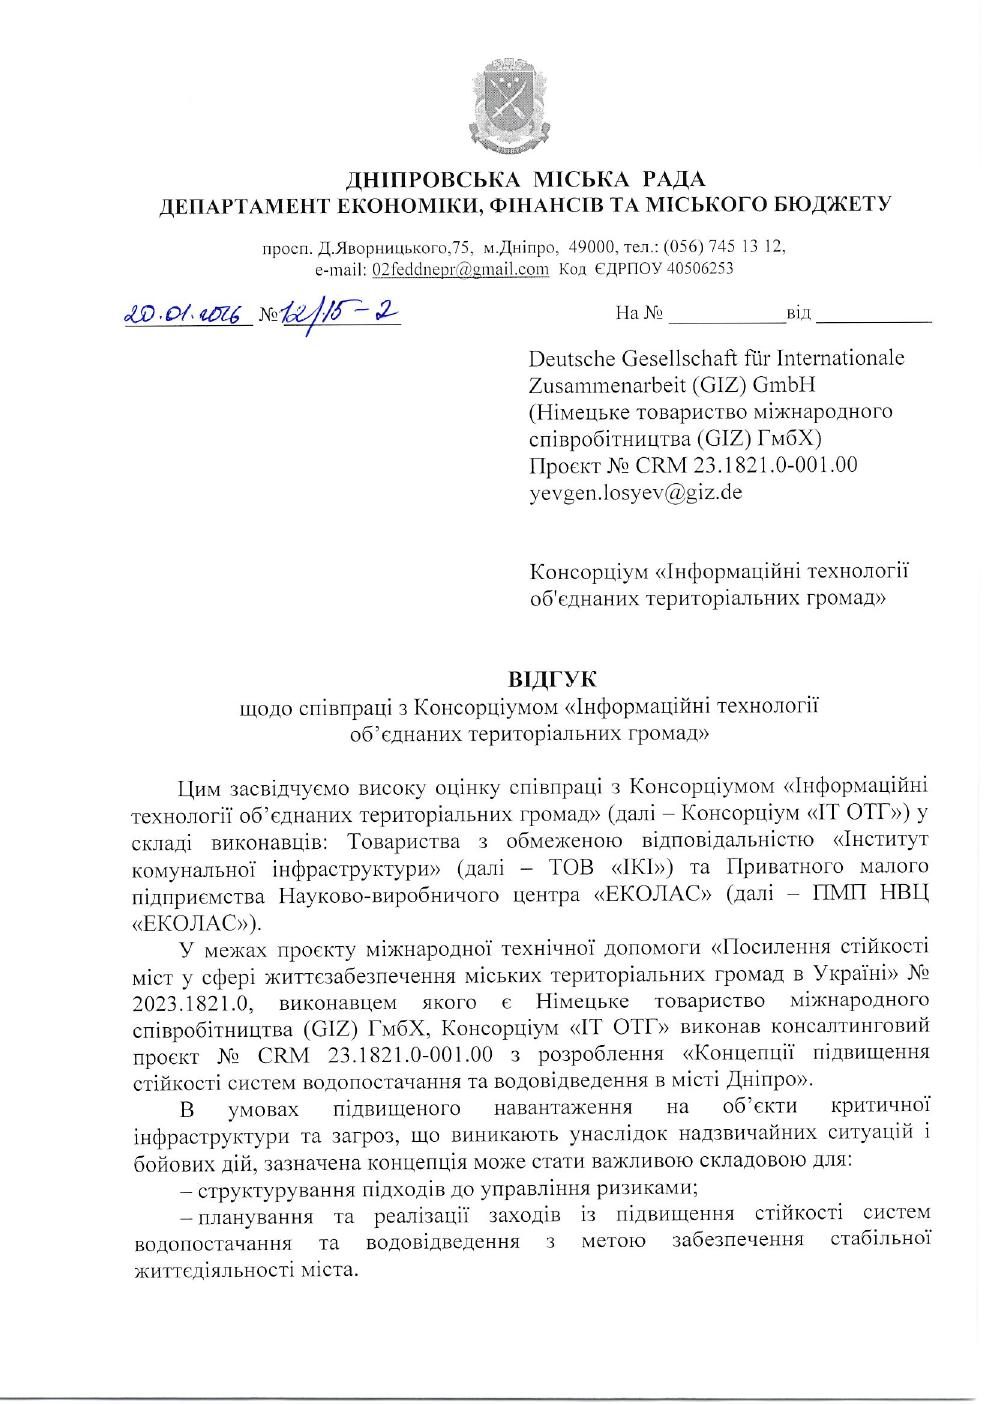 IT OTG Consortium
 Integrated founder experience